Executing automated UI tests may result in bad performance or in a failed test because a UI element could not be found. So how we are going to analyze the automated UI test? The test execution engine also includes tracing functionality. In our case, we would like to have a detailed report that shows what is exactly going on during the test. This feature is known as HtmlLogger. This trace logger can be configured at three location / levels:
- QTAgent Configuration
For every test run on this system. Since this setting is global, it is not practicable. - UI Test Library
This enables the logging for a specific test assembly. Practical to specify a logging level for all test in this assembly. - By code in the test method
This enables you to enable or reconfigure the logger settings directly inside the test method. i.e. just a special case could be logged with more details.
In this post we will have a look at the two latter configuration options.
Application Configuration File in Test Assembly
An easy way to define the HTMLLogger is to add an App.config file to the assembly which contains the UI test. In this configuration file we add a
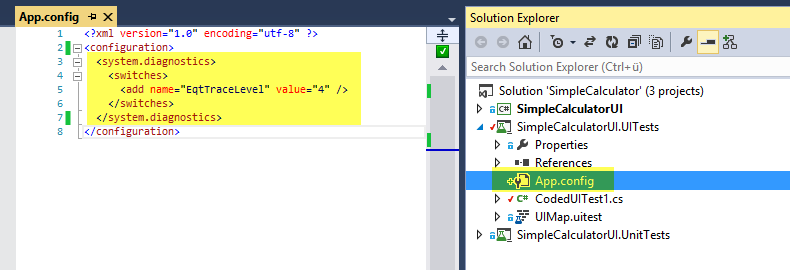
The following trace levels can be set:
- 0 = Off
- 1 = Errors only
- 2 = Errors and warnings
- 3 = Errors, Warnings and information
- 4 = All, including verbose information
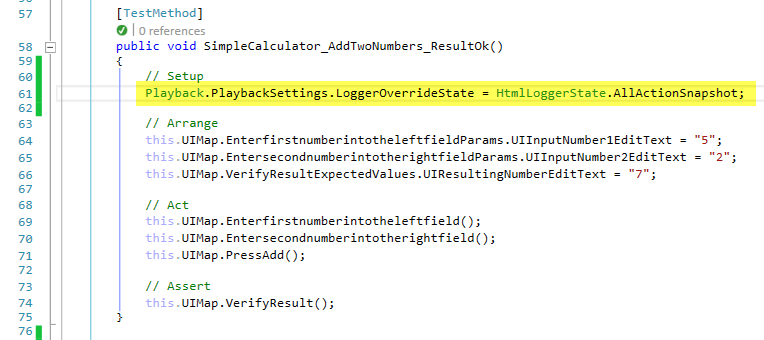
HtmlLoggerState by Code
The second possibility to configure the logging is to enable it directly in the test method implementation. This settings are available in Playback.PlaybackSettings.LoggerOverrideState.
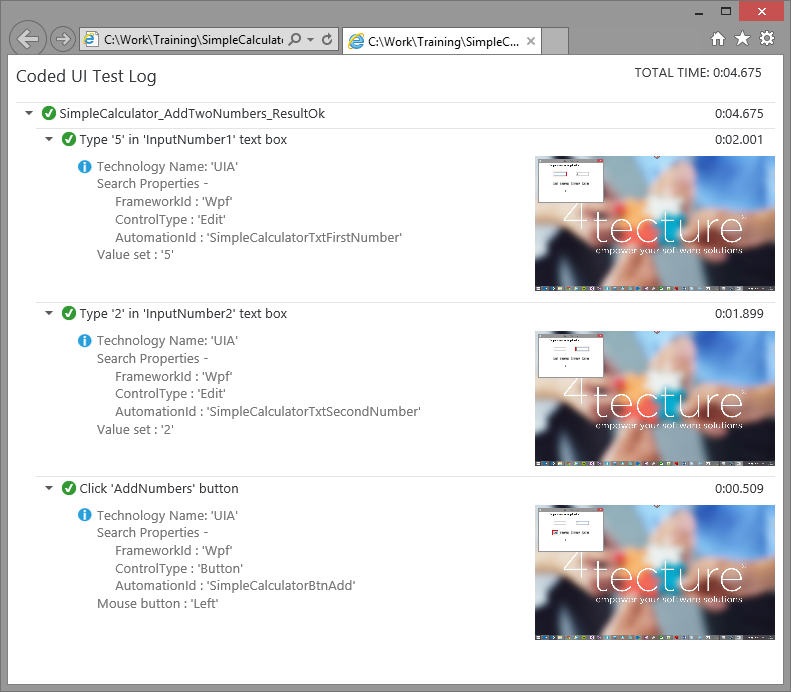
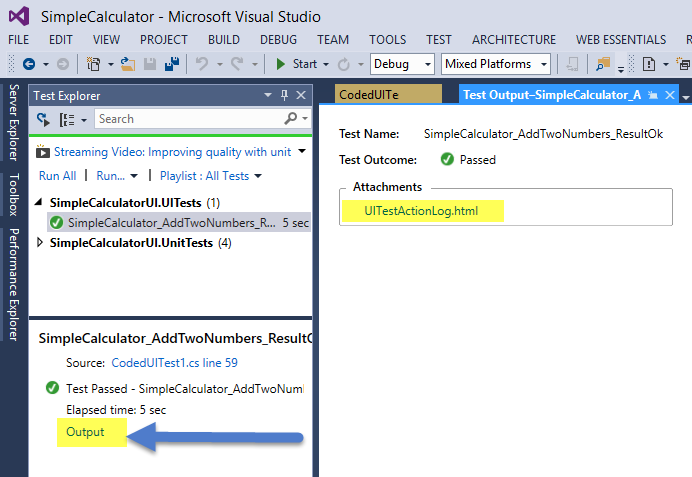
Logger Output
If the logger has been enabled, a html log file is attached to the test results.
The log can now be analyzed in a browser. It shows all information to the control localization as well as additional verbose information. This information is helpful to optimize your UI tests.